012: The MTTI Manifesto
Mean Time to Isolate
Your services are down. Alerts are firing. Customers are screaming. The incident channel is filling up.
And nobody has a damn clue where to start looking.
Welcome to the isolation phase – that chaotic state between knowing you have a problem and knowing which component has a problem. It's the most expensive manhunt in your infrastructure, and you're not measuring it.
The Missing Metric
We've spent years charting different parts of our outages. Mean Time to Detect (MTTD) tells us how long our system burns before someone notices the smoke. Mean Time to Repair (MTTR) tells us how long until the fire's out. But between these familiar metrics lies, there's an untapped wasteland.
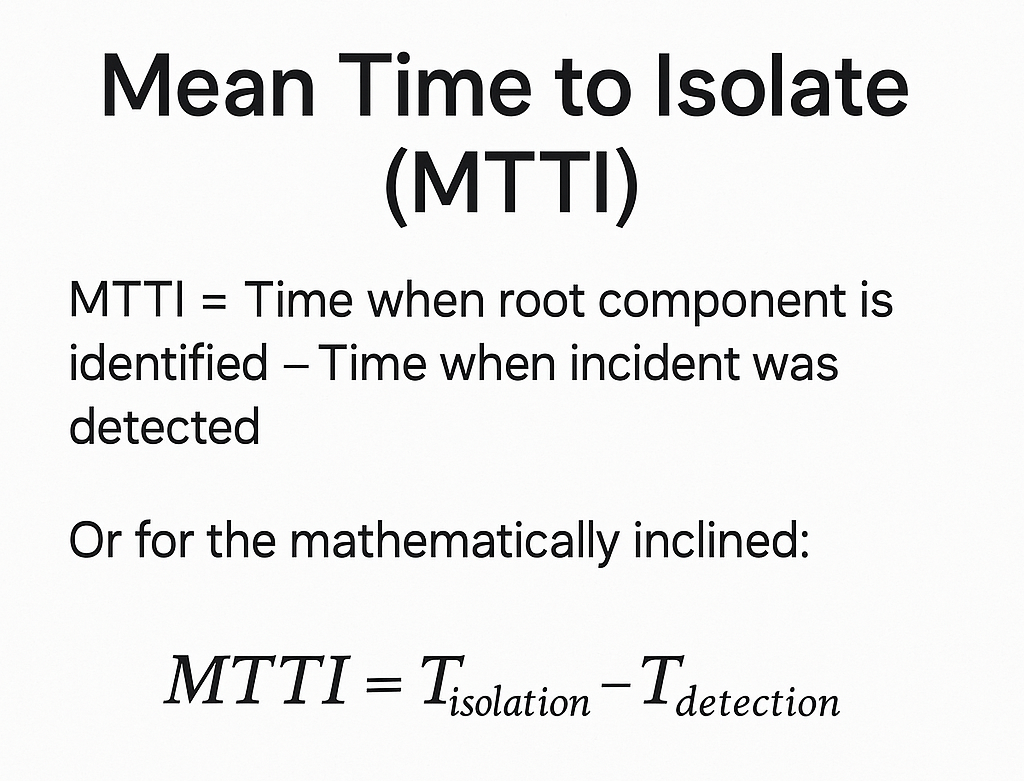
💡 Mean Time to Isolate (MTTI): The time it takes your team to pinpoint which service, component, or system is actually causing the problem.
Simply stated:
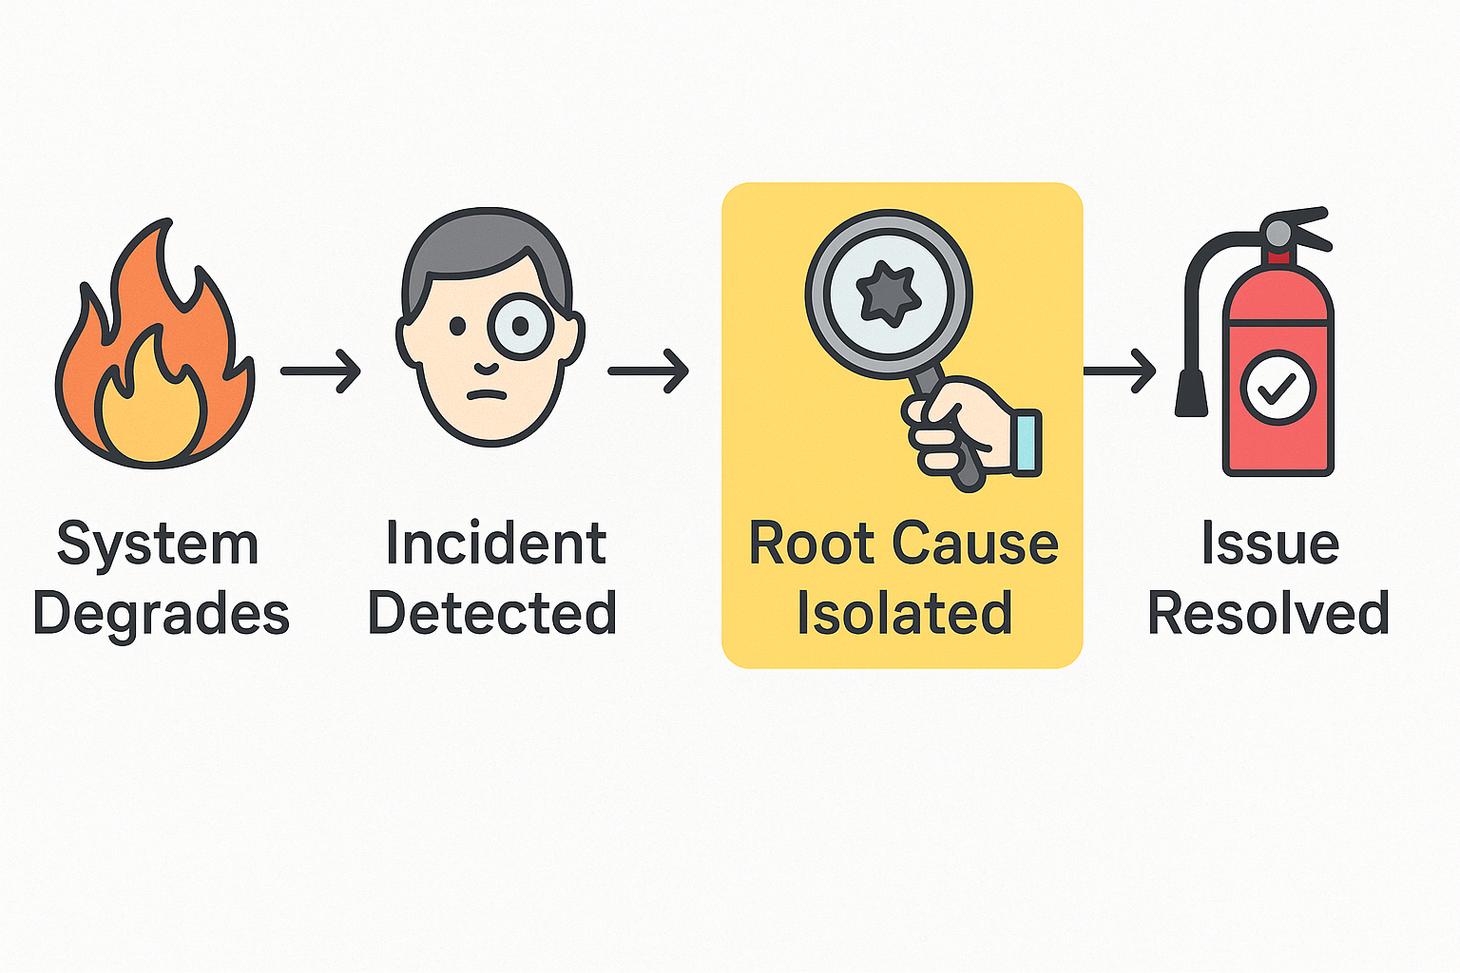
The modern incident timeline now looks like this:
- MTTD: System degrades → Someone acknowledges the alert
- MTTI: Someone acknowledges the alert → "It's in service X!"
- MTTR: "It's in service X!" → Everything's working again
Here's the dirty secret of modern architecture: In most organizations, 60-80% of total incident time is spent in isolation, not repair. You're burning daylight while engineers play digital detective across dozens or hundreds of services.
The Anatomy of a Goose Chase
It's 3:13 AM. Your phone vibrates with that special intensity reserved for production issues.
Latency is spiking. Errors are climbing. Revenue is dropping. The clock starts now.
You log in. Dashboards show everything burning, but nothing tells you why. You message the team: "Anyone seen this before?"
More engineers pile into Slack. Everyone's checking different services, comparing notes, trying theories.
"Let's restart the API gateway."
"Maybe it's the database?"
"Who owns the auth service again?"
"Is Kubernetes acting up?"
"Did anyone deploy at 3 AM?"
"This has to be a Cloudflare issue, let's check their status page."
Two hours later, someone finally pins it down: the recommendation engine is sending malformed requests after a quiet deployment that finished a couple of hours before the alerts fired.
Total incident time: 2 hours, 13 minutes.
Actual fix time: 8 minutes to roll back.
MTTI: 2 hours, 5 minutes of pure organizational chaos.
That's two hours where customers couldn't check out, and your team spent precisely zero of those minutes fixing the actual problem. They spent it all wandering the labyrinth of your microservices.
You Can't Fix What You Can't Find
A bloated MTTI exposes fundamental problems in how you build and operate systems:
1. Your Dependency Graph Only Exists in People's Heads
"Ask Rajiv about the inventory service dependencies. He built it three years ago, right before he moved to a different team."
When your architecture knowledge lives exclusively in tribal lore, your MTTI will always be hostage to who's awake, who's available, and who still remembers how things actually work.
2. Conway's Law Is Having Its Revenge
Your org chart has eight teams, each owning twelve services, that talk to each other in ways that mirror your reporting structure rather than any sensible technical boundary. The result? When something breaks, five teams have to coordinate just to figure out where to start looking.
3. Your Instrumentation Is From The Stone Age
"Let's check the logs" doesn't cut it when a request traverses 15+ services. Without distributed tracing and service topology visibility, you're essentially using a flashlight to search a mountain range.
4. Ownership Is Theoretical, Not Practical
During your last incident, someone actually asked, "Who owns this service?" and it took 15 minutes to find an answer. If your on-call rotation doesn't map cleanly to your service boundaries, your MTTI is guaranteed to be astronomical.
5. Your Runbooks Are Fiction
They describe a system that existed six months and eighty deployments ago. They're archaeological artifacts, not useful guides.
The Culture Shift
Tracking MTTI forces cultural changes that improve everything:
1. Dependency Documentation Becomes Mission-Critical
When teams know they'll be measured on isolation speed, documenting service dependencies becomes a priority, not a burden. Architecture diagrams move from PowerPoint artifacts to living documents that teams actually maintain.
2. Observability Investments Get Prioritized
"We need better monitoring" becomes "We need to shave 30 minutes off our MTTI, and here's exactly how better tooling will do that."
Suddenly, that distributed tracing project that's been languishing for months has a clear ROI: "This will reduce our MTTI by 40%, saving us approximately 20 engineering hours per week."
3. Cross-Team Coordination Improves
When you measure how long it takes to hand off incidents between teams, those handoffs magically become more efficient.
Teams start creating "isolation interfaces" – clear documentation of how their services should be debugged by outsiders. They define entry points, key metrics, and common failure modes that other teams can use during incidents.
4. Architecture Reviews Include 'Isolatability'
"How will we know if this service is failing?" becomes a standard design question.
Teams begin factoring debuggability into their architectural decisions. Service boundaries become clearer. Observability gets baked in from the start, not tacked on later.
The Impact
The financial impact of high MTTI is staggering but largely invisible. The less quantifiable costs are also damaging:
- Customer trust erosion: Each extra minute of downtime creates exponentially increasing frustration
- Engineering morale impact: 3AM troubleshooting sessions with no clear direction burn people out
- Opportunity cost: Time spent in chaotic incident calls is time not spent on innovation
Making MTTI Visible
You can't improve what you don't measure. Here's how to start tracking MTTI today:
- Update your incident template Add explicit fields for:
- Incident detected: [timestamp]
- Root cause service/component identified: [timestamp]
- Fix implemented: [timestamp]
- Visualize the isolation tax Create a stacked bar chart showing the proportion of each incident spent on detection, isolation, and repair. The isolation segment will be painfully large.
- Map the detective work Create a "service investigation timeline" showing which services were examined, when, and by whom. The resulting spaghetti diagram will be a wake-up call.
- Trace every transaction Distributed tracing isn't optional anymore. Without it, your team is essentially searching for a needle in a haystack while blindfolded.
- Build service topology maps Automatically generate and maintain visualizations of how your services actually interact, not how you think they interact.
Dashboards That Actually Help
The problem with most dashboards is they show symptoms, not causes. Here's how to build isolation-focused visibility:
1. The Isolation Console
When an incident begins, automatically generate a custom dashboard showing:
- The affected service and all its dependencies
- Recent changes across the dependency tree
- Health metrics for each potential culprit
- Links to relevant logs and traces
2. Dependency-Aware Alerts
Transform your alerts from "Service A is down" to "Service A is experiencing 40% error rate, likely due to Database B showing increased latency." Include:
- Health status of all dependencies
- Recent changes to dependencies
- Links to proven troubleshooting paths
3. The Cross-Team Visibility Layer
The most insidious MTTI killer is the cross-team visibility gap. Create a service health dashboard that shows:
- Each team's services
- Their dependencies across team boundaries
- Health metrics in a consistent format
- Clear ownership and escalation paths
This cross-team collaboration dashboard should include:
- Team Contact Cards: Who to page for each service
- Service SLO Status: Is the service meeting its reliability targets?
- Dependency Score: How many other services depend on this one?
- Change Velocity: Recent deployment frequency as a risk indicator
4. The Isolation Path Tracker
During incidents, capture which services are being investigated, when, and by whom. This creates a real-time map of the isolation process and highlights inefficiencies.
The 30-Day MTTI Challenge
Ready to fix this? Here's your plan:
Week 1: Baseline
- Add MTTI tracking to your incident process
- Calculate approximate MTTI for your last 10 incidents
- Document your current isolation process
Week 2: Mapping
- Generate a complete service dependency map
- Identify the top 5 services with the highest fan-in/fan-out
- Document ownership for every service
Week 3: Instrumentation
- Deploy distributed tracing to your top 10 most critical paths
- Create dashboards showing request flows across services
- Update runbooks with isolation procedures
Week 4: Practice
- Run 3 chaos engineering exercises focused specifically on isolation
- Time how long it takes to identify which service is failing
- Measure your new MTTI and celebrate the improvement
What Good Looks Like
Based on observations across organizations of different sizes, here's what MTTI typically looks like:
| Environment Scale | Poor MTTI | Average MTTI | Elite MTTI |
|---|---|---|---|
| Small (< 20 services) | > 30 min | 15-30 min | < 10 min |
| Medium (20-100) | > 60 min | 30-60 min | < 20 min |
| Large (100-500) | > 120 min | 60-120 min | < 30 min |
| Hyperscale (500+) | > 180 min | 90-180 min | < 60 min |
Note: These benchmarks represent logical targets based on industry experience and conversations with other SRE leaders rather than formal empirical studies, as MTTI is not yet widely measured.
Organizations with elite MTTI share these traits:
- Comprehensive service ownership
- Mature observability practices
- Up-to-date dependency documentation
- Regular chaos engineering focused on isolation
The Bottom Line
Every minute spent wandering your architectural wilderness is a minute of customer pain, burned engineering time, and lost revenue. MTTI isn't just another acronym – it's the metric that forces you to confront how well you actually understand the system you've built.
For executives and leaders:
- Every minute reduced in MTTI directly translates to preserved revenue and engineering capacity
- MTTI exposes organizational debt. High MTTI reveals cross-team friction and knowledge silos
For engineers:
- MTTI reframes observability investments from "nice to have" to "business critical"
- MTTI justifies tooling and automation. Every manual step in isolation becomes a target for elimination
Stop pretending your incidents are primarily detection or repair problems. They're isolation problems, and you can't fix what you can't find.
Your customers don't care why your system is down. They care that it is. And every minute your team spends saying "I think it might be service X, let me check" is a minute too long.
Measure your MTTI. Fix your MTTI. Watch everything else improve.
In the high-stakes game of incident response, the fastest path to resolution isn't better fixes – it's better detective work.
Old School Burke Newsletter
Join the newsletter to receive the latest updates in your inbox.
